Here’s a convenient one liner to chronologically plot data on the command line
Screenshot
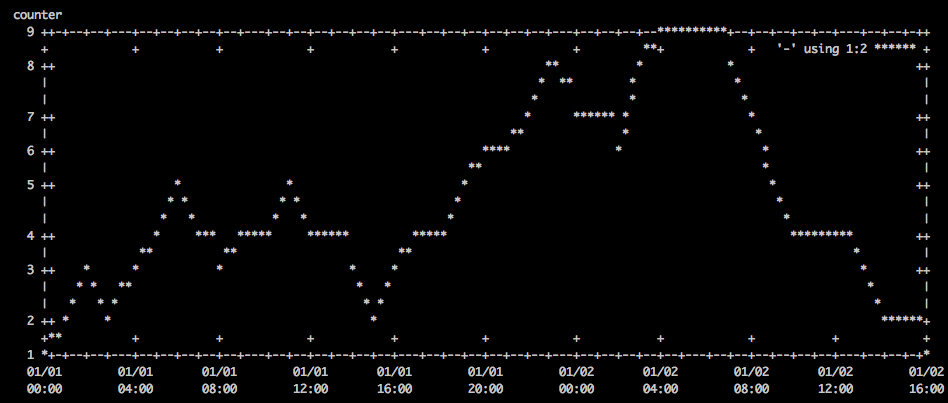
Command
export width=`stty size | cut -d " " -f2`; export height=`stty size | cut -d " " -f1`-10; cat /tmp/data | sed "s/ /T/" | gnuplot -e "set terminal dumb $width $height; set autoscale; set xdata time; set timefmt \"%Y-%m-%dT%H:%M:%S\"; set xlabel \"time\"; set ylabel \"counter\"; plot '-' using 1:2 with lines"
Data
/tmp/data contains the following:
2000-01-01 00:00:00 1
2000-01-01 01:00:00 2
2000-01-01 02:00:00 3
2000-01-01 03:00:00 2
2000-01-01 04:00:00 3
2000-01-01 05:00:00 4
2000-01-01 06:00:00 5
2000-01-01 07:00:00 4
2000-01-01 08:00:00 3
2000-01-01 09:00:00 4
2000-01-01 10:00:00 4
2000-01-01 11:00:00 5
2000-01-01 12:00:00 4
2000-01-01 13:00:00 4
2000-01-01 14:00:00 3
2000-01-01 15:00:00 2
2000-01-01 16:00:00 3
2000-01-01 17:00:00 4
2000-01-01 18:00:00 4
2000-01-01 19:00:00 5
2000-01-01 20:00:00 6
2000-01-01 21:00:00 6
2000-01-01 22:00:00 7
2000-01-01 23:00:00 8
2000-01-02 00:00:00 7
2000-01-02 01:00:00 7
2000-01-02 02:00:00 6
2000-01-02 03:00:00 8
2000-01-02 04:00:00 9
2000-01-02 05:00:00 9
2000-01-02 06:00:00 9
2000-01-02 07:00:00 8
2000-01-02 08:00:00 7
2000-01-02 09:00:00 5
2000-01-02 10:00:00 4
2000-01-02 11:00:00 4
2000-01-02 12:00:00 4
2000-01-02 13:00:00 3
2000-01-02 14:00:00 2
2000-01-02 15:00:00 2
2000-01-02 16:00:00 1