IPv6 link-local address to MAC address online converter
The converter
https://ben.akrin.com/ipv6_link_local_to_mac_address_converter/?mode=api&ipv6=fe80::5074:f2ff:feb1:a87f
for all your API needs.
Description
This converter was implemented per Dave Russell’s suggestion as a follow up to the MAC address to IPv6 link-local address online converter. If you are interested in the steps behind this conversion, they are simply a reverse of the original Mac->IPv6 converter.
Please note that of the various IPv6 notations, the one this script will expect is fe80::xxxx:xxxx:xxxx:xxxx.
A solar powered blog
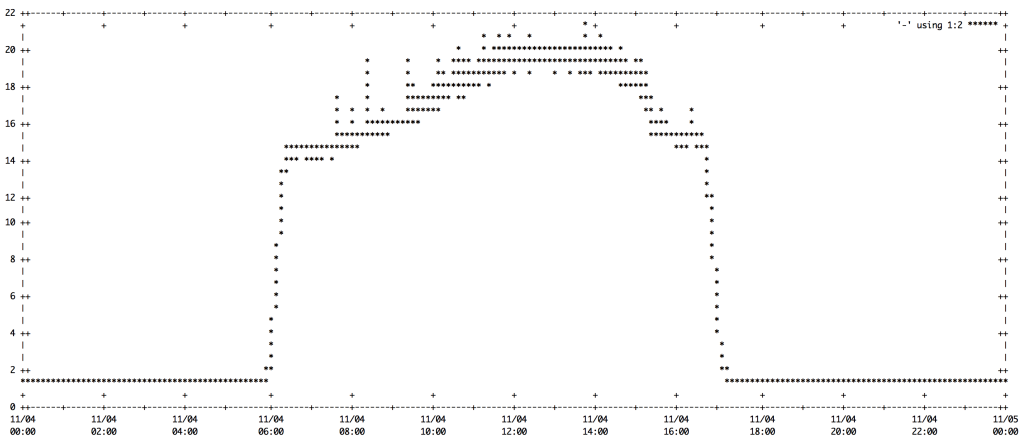
This blog is now powered by a Raspberry Pi using 100% solar energy. Nicole instrumented the Phidgets sensors so we would gain some visibility into our electricity production & consumption. This has already given us some great insights. We can see the effect that each device we use has on the system: how much the LED lamps take to charge, the hole that the inverter blasts through the battery when turned on. We can tell that not all sunny days are created equal in their ability to give a charge. We can even tell the increase in electricity consumption that rsyncing a whole bunch of data to the Pi has: 0.03A.
The sensors
- solar panels volts (a good indicator of sunlight)
- input amps (indicates when the charge controller uses produced electricity)
- output amps / load (what we consume with various devices)
- battery volts (whether this blog will make it through the night or not)
For now I’m only graphing using the Gnuplot one-liner from Hell. More to come…
It blows my mind way too hard that I have a system in which sunlight comes in and organized information comes out. And by organized information I mean lolcats.
